
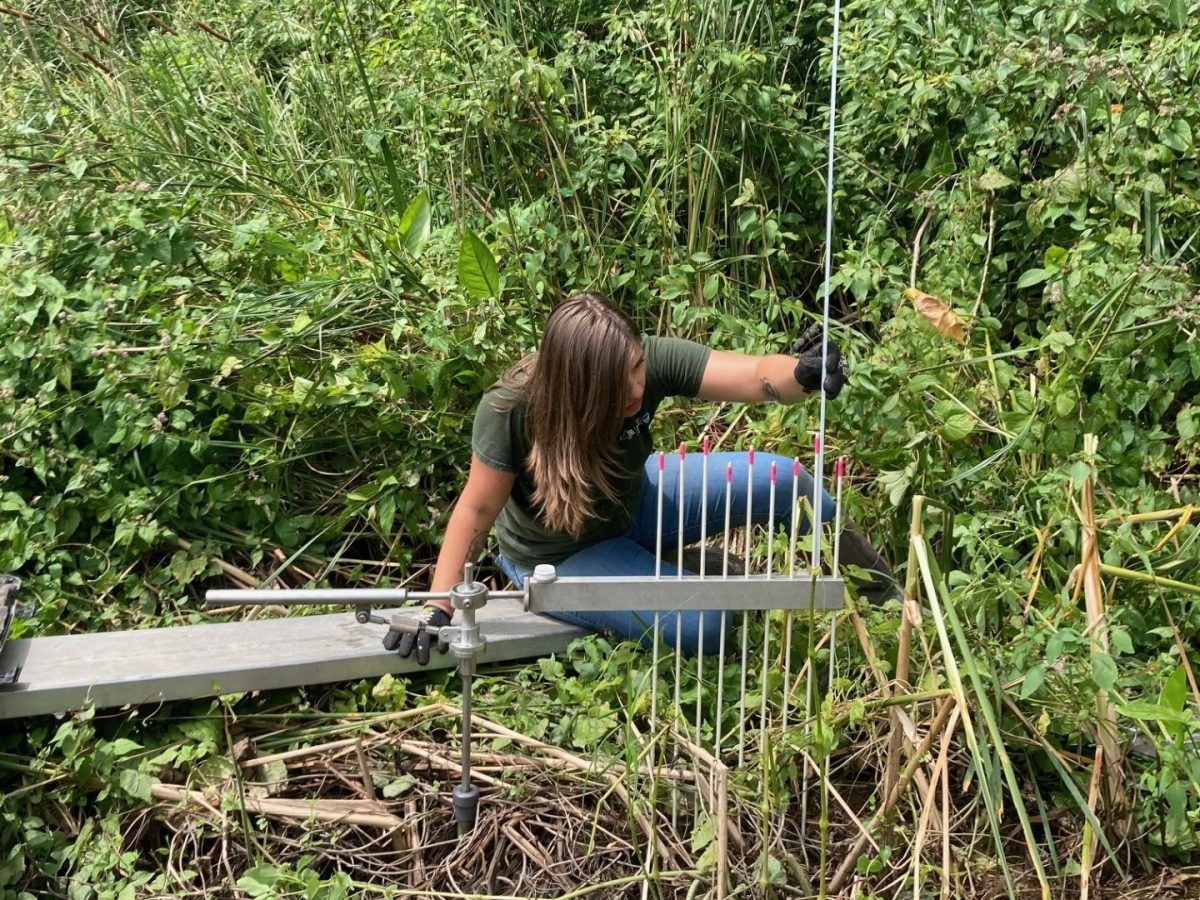
One of the many environmental monitoring programs at HRNERR involves tracking sediment accumulation in our component site marshes using surface elevation tables (SETs). Analyzing rates of marsh surface elevation change, in the context of local sea level changes, can help identify patterns to determine how resilient our tidal wetlands are to sea level rise (SLR) here in the Hudson River Estuary.
What is a SET?
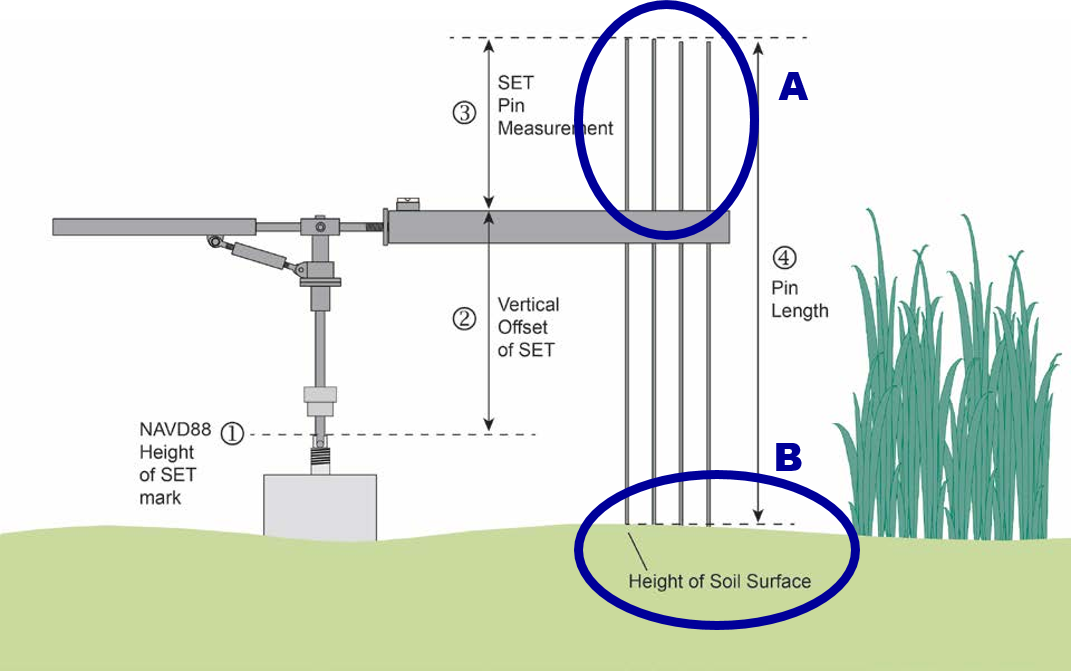
A surface elevation table (SET) consists of two main parts: a permanent sampling station and portable equipment designed to attach to it. The permanent station is a rod driven into the ground as deeply as possible to prevent movement over time. A portable collar attaches to the permanent rod and has a horizontal arm that reaches out over the marsh surface at fixed positions. Long narrow pins of equal length are inserted vertically through holes drilled in the arm. Then, an observer measures the height of each pin (A) above the arm to determine height of the wetland surface (B). The arm is then moved to another fixed orientation around the SET rod and the process is repeated. These measurements are repeated over time. Because of the stability of the SET mark, each pin is lowered to the surface in the same location each time. After several years of repeat observations, scientists can calculate a “rate of change” for the marsh surface.
SETs at HRNERR
The Reserve footprint includes both freshwater and brackish tidal marshes. To study marsh elevation changes in both systems, HRNERR has permanent SET stations in Tivoli Bays (freshwater) and Piermont Marsh (brackish). These sites also differ in their dominant vegetation: Tivoli Bays consists primarily of narrowleaf cattail (Typha angustifolia), and Piermont Marsh of common reed (Phragmites australis). HRNERR has been monitoring SETs in Tivoli Bays since 2012 and at Piermont Marsh since 2019 at a total of 15 locations, which are visited multiple times per year.
Using SETr, an R package designed for analyzing National Estuarine Research Reserve System (NERRS) SET data, Reserve Habitat Researcher Christina Pacella was able to calculate cumulative change in elevation at each monitoring location and found that nearly all of our SET monitoring sites have positive rates of elevation change, which indicates that marshes are accreting sediment rather than eroding.
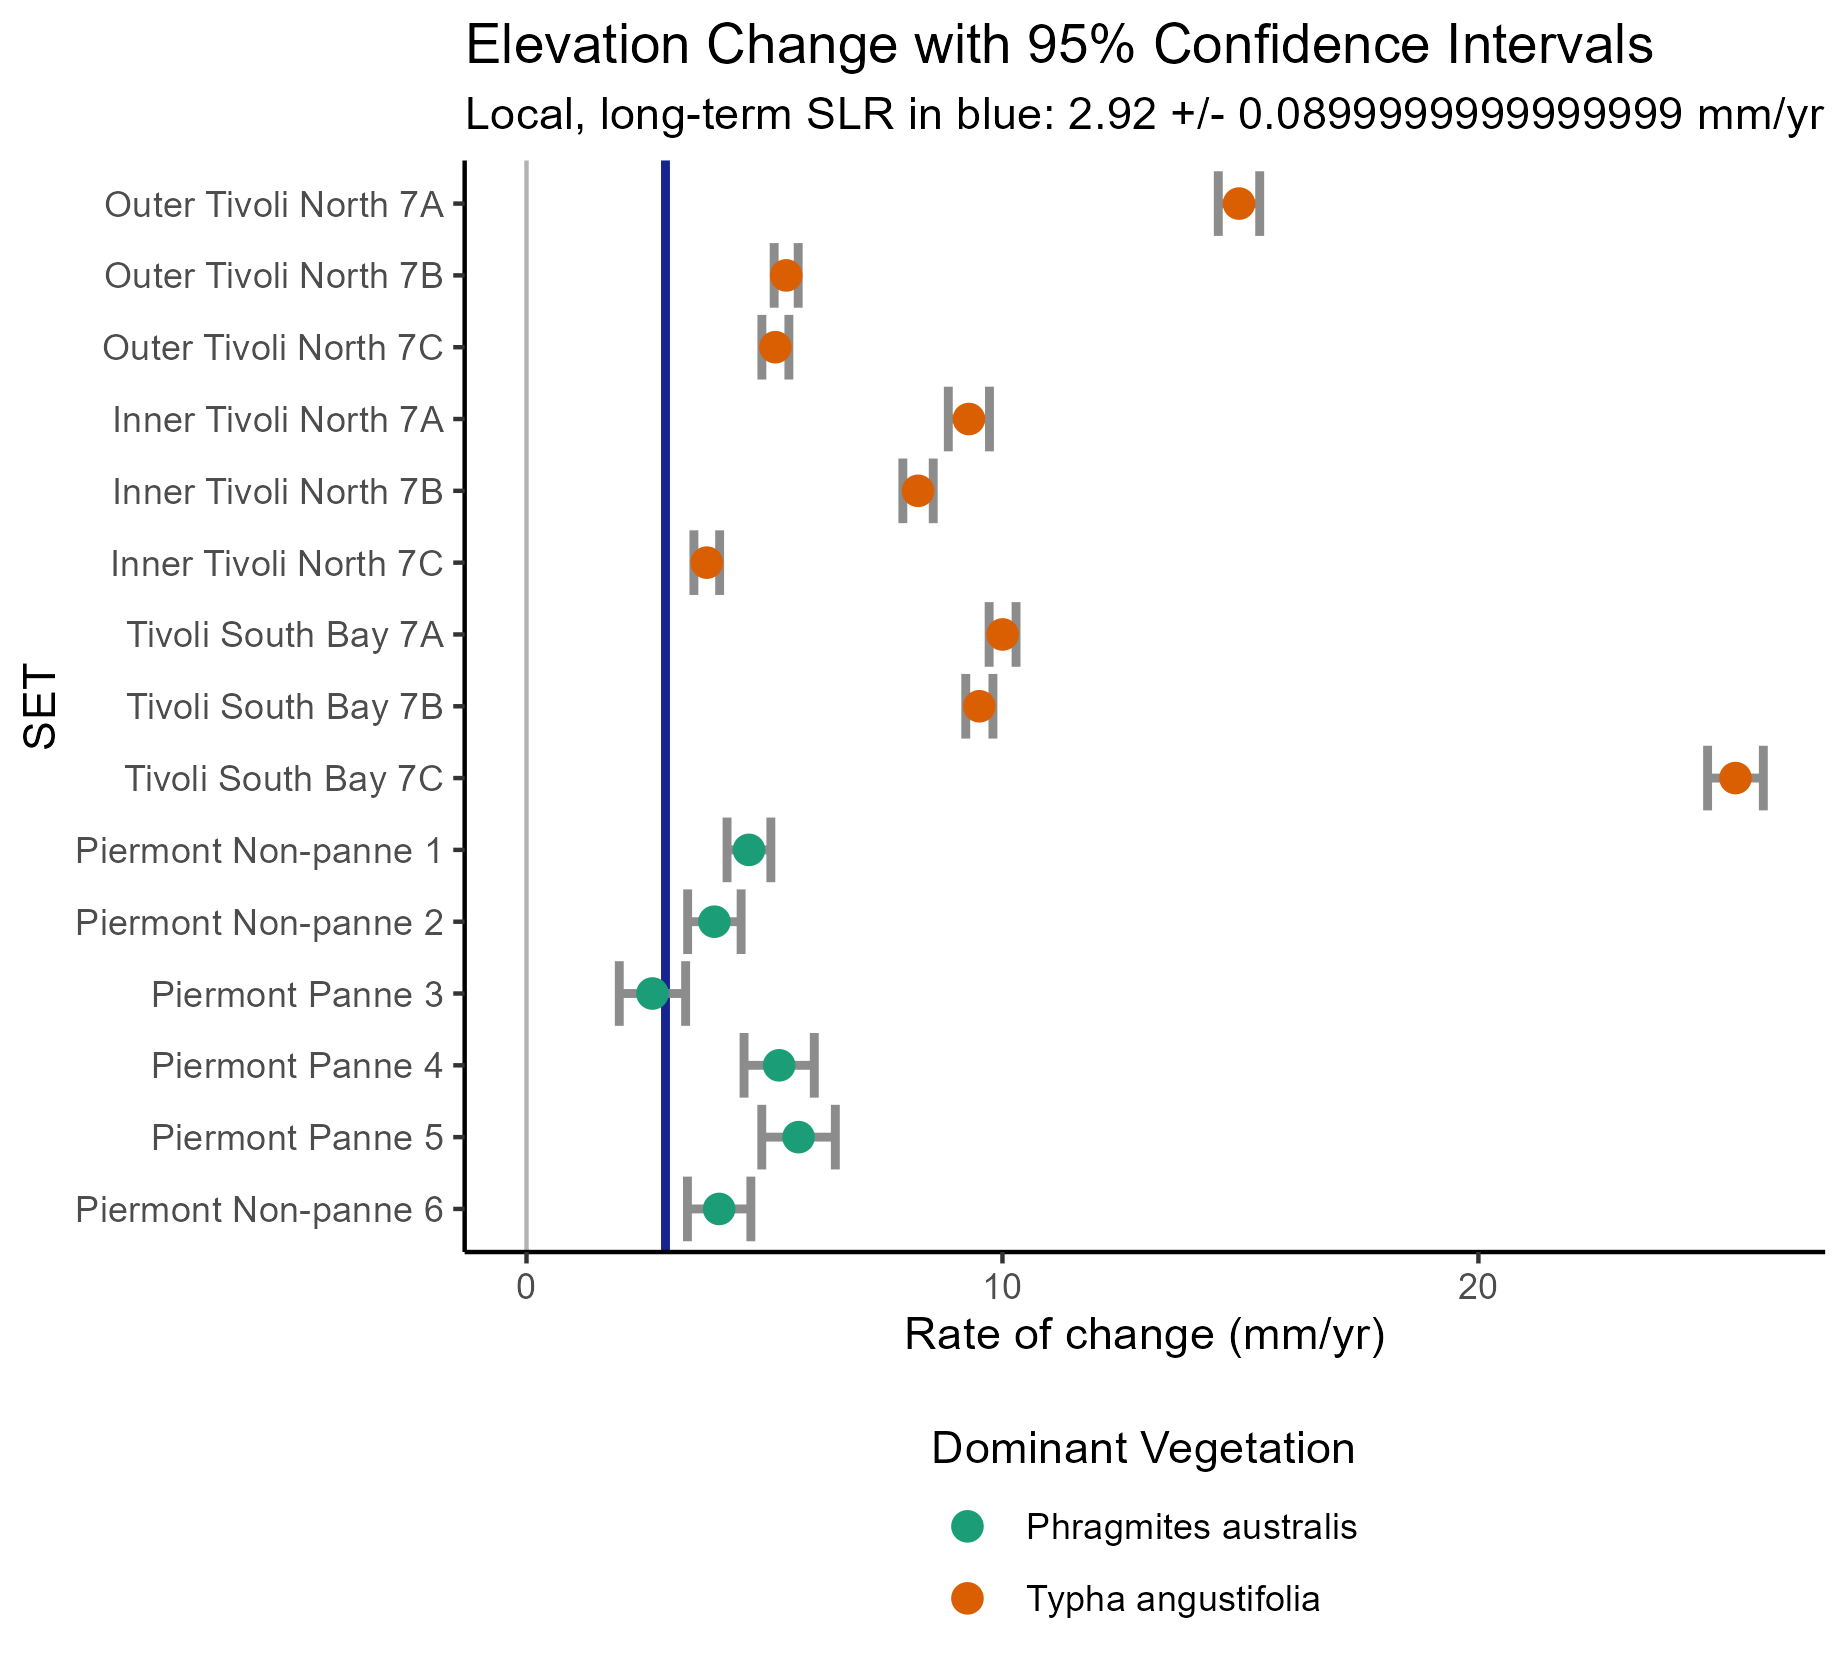
However, in our determination of marsh resilience, we must also account for rising sea levels in the Hudson. While our marshes may be accreting, it may not be at a rate great enough to keep up with rising water. Data from the tide station at The Battery in New York City from 1856 to 2023 were used to calculate the local rate of sea level rise of 2.92 +/- 0.09 millimeters per year.
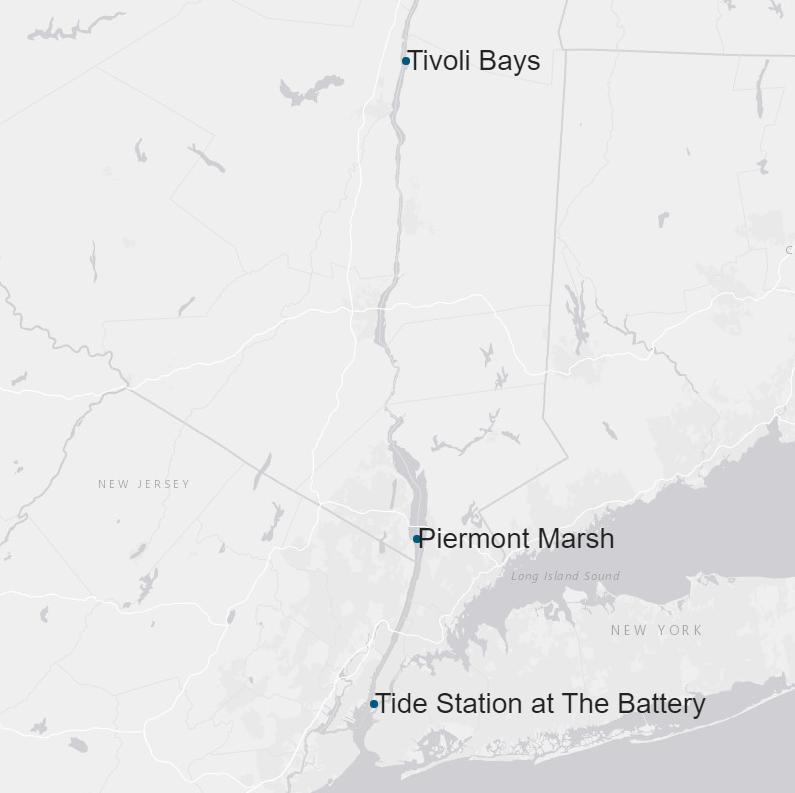
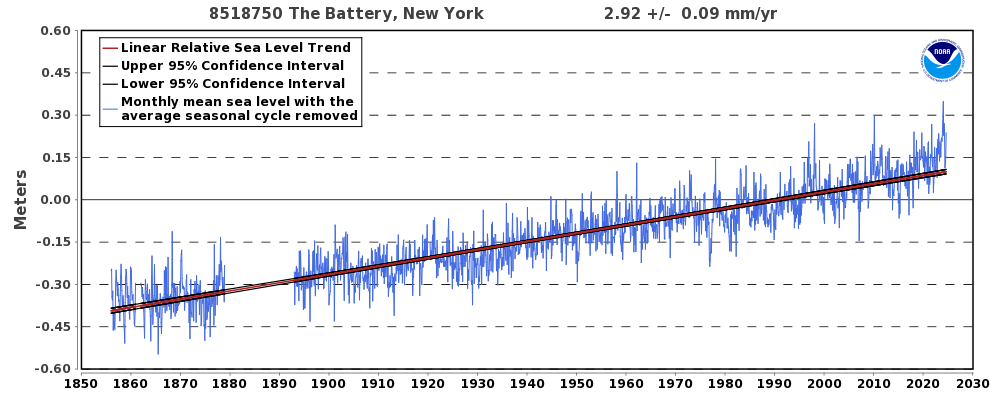
When marsh surface elevation changes at HRNERR monitoring locations and SLR are graphed together, we can see that almost all sites have an elevation change rate greater than the rate of SLR. This suggests that our marshes are keeping pace with rising water levels.
Further Monitoring
While the findings of this analysis suggest that marshes will be able to keep up with sea level rise in the Hudson River Estuary, it is important to continue to monitor SETs as sediment deposition and sea level rise are both highly dynamic processes. In future analyses, it will be possible to include water level data from the HRNERR-operated tide station at Turkey Point, which will have higher-resolution local sea level rise estimates.
You can learn more about HRNERR’s environmental monitoring by visiting our Science page.
This analysis was made possible by the NERRS Science Collaborative Project SETr: Developing Tools and Visualizations to Track Changes in Wetland Surface Elevation. For more information visit the Science Collaborative website.