
Camille Seliquini, System-Wide Monitoring Program Intern, and Teagan Russell, Water Quality Monitoring Intern, share how the Hudson River National Estuarine Research Reserve’s meteorological and water quality monitoring network captures the impacts of extreme weather in the estuary watershed.
Unpacking 1000-Year Weather Events
Heavy rainfall throughout New York in July led to claims of a ‘1000-year event,’ but what does that mean? How do we determine how often a rain event occurs if we don’t have 1000 years of data? We can use a statistical tool called a distribution to determine the relationship between magnitude of rainfall and the probability of that magnitude occurring. To do this we need data for the range of total rainfall and the number of occurrences for each amount of rain (Figure 1). Then, we can apply the distribution curve over our data and see the probability for any given rainfall amount (Figure 2).
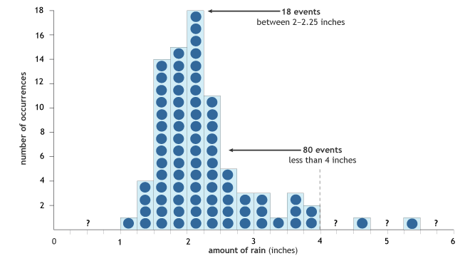
Figure 1 – Graph of example rainfall events.
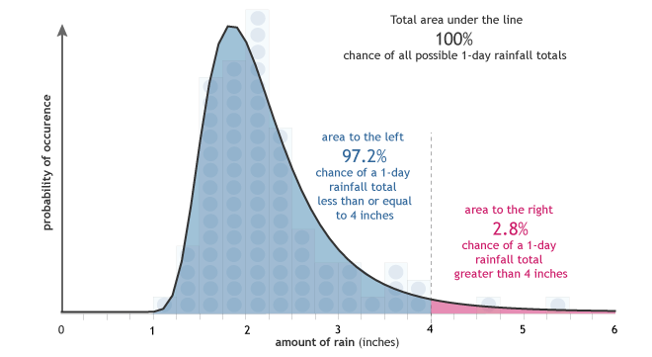
Figure 2 – Distribution curve applied to example data.
We can also figure out what rainfall amounts correspond to specific probabilities. For example, a 1-in-1000-year event is equivalent to a 0.1% probability. The probability of an event is location specific, something that occurs often in Florida would not occur at the same frequency in New York, which impacts the statistical distribution.
Another tool for analyzing rain events is Precipitation Frequency (PF) Estimates (PF Data Server-PFDS/HDSC/OWP), which consider a rain event’s location, duration, and total precipitation to determine how frequently that event would occur. We can use data from HRNERR’s meteorological station at the Norrie Point Environmental Center in a PF model to calculate the rarity of a rain event. On July 21, the Norrie Point station reported that 3.35 inches of rain accumulated in one hour. That data can be placed on a Precipitation Frequency Estimate chart, allowing us to see how often that frequency of rain is likely to occur at Norrie Point. According to the chart, a rain event at Norrie Point with a rate of 3.25 inches of rain per hour is likely to occur about once every 500 years.
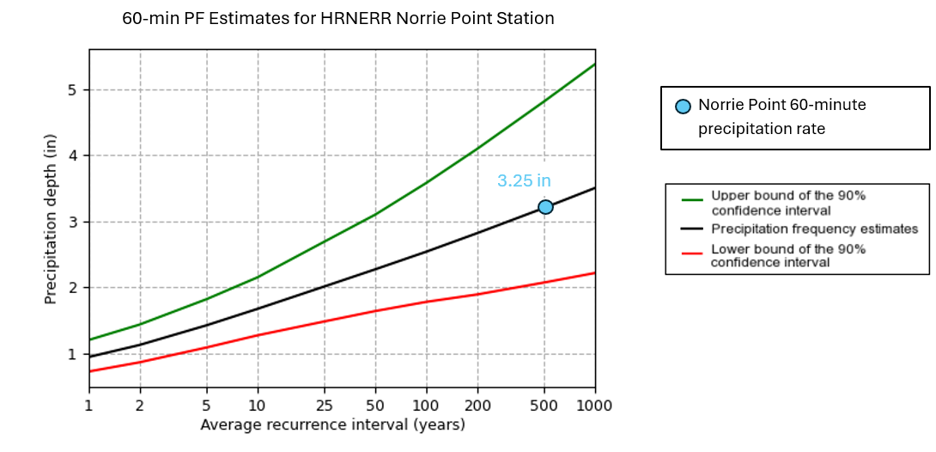
Figure 3 – Precipitation Frequency Estimates calculated using data from the metereological data from Norrie Point Environmental Center.
Turbidity Makes the Picture Clearer
The research team at HRNERR captured the July surge in precipitation across its network of meteorological stations. Water quality monitoring instruments are also deployed at these stations, allowing us to observe the impact of weather on water quality. One of the most visible impacts of precipitation on the Hudson is turbidity, a measure of water clarity.
What contributes to turbidity in the Hudson? Small, suspended inorganic particles such as silt and clay decrease water clarity, as well as biological materials such as microorganisms, algae, and decaying organic matter. A body of water with low turbidity allows an observer to easily see what is happening beneath the water’s surface, while a body of water with high turbidity appears murkier. In essence, turbidity is a measurement of how easily light can pass through water.
Precipitation is another environmental factor that impacts turbidity in multiple ways. Rainwater runoff from the surrounding landscape will deposit sediment into the Hudson, adding to the suspended particles in the river which block and scatter light. In addition, heavy rainfall will increase water velocity, stirring up settled materials at the bottom of the river and resuspending them within the water column. Higher water velocity will also increase the rate of erosion along the banks of the Hudson and its tributaries, increasing sediment load within the river.
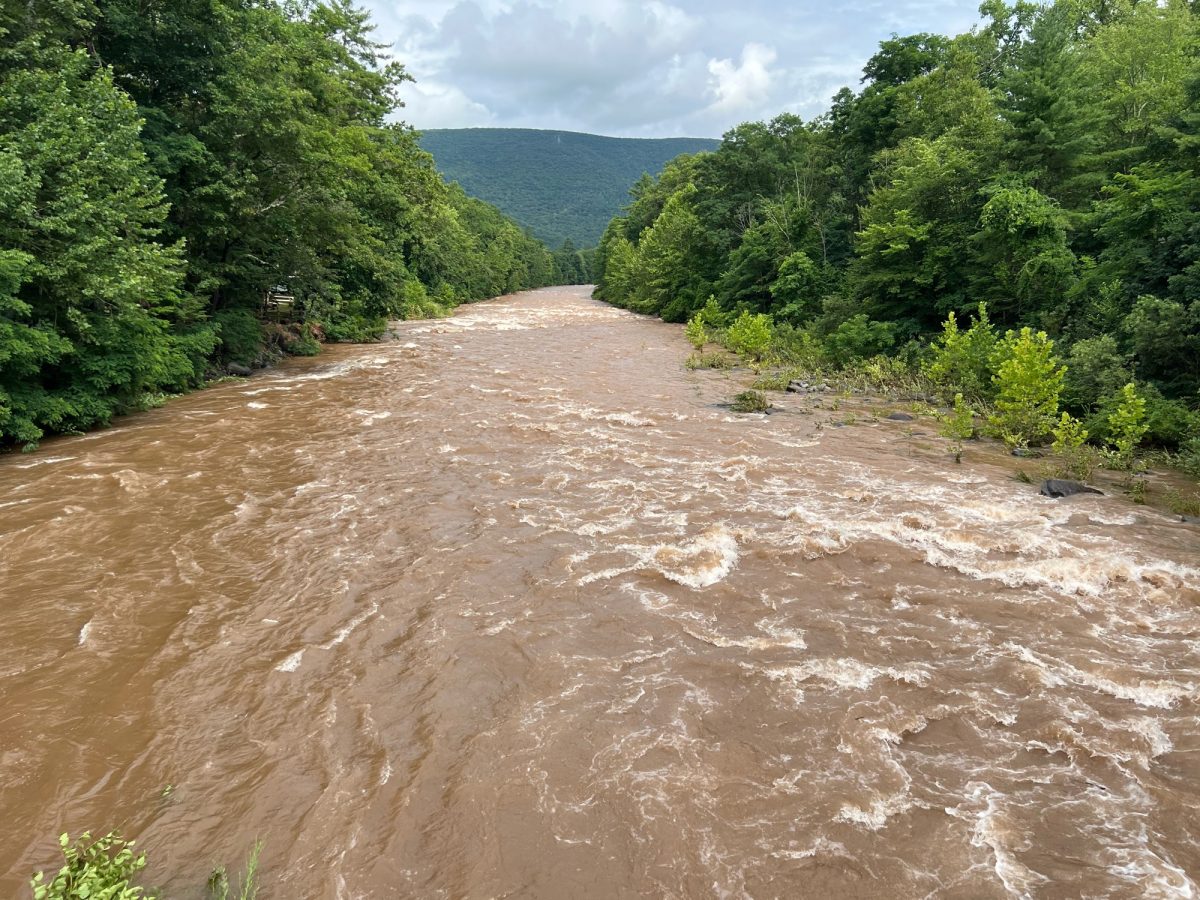
Woodland Creek (Ulster County, NY) shows high water velocity and turbidity following heavy rainfall on July 29, 2026. Media source: MyCoast Flood Watch Report.
The meteorological and water quality data collected at Norrie Point Environmental Center were used to graph precipitation and turbidity from June-August 2026. This graph shows a spike in precipitation followed by a spike in turbidity. After a heavy rain event, we see the turbidity measurements rising in response to runoff, increased water velocity, and erosion. With these long-term datasets, researchers are better able to understand impacts of severe weather events and trends in water quality.
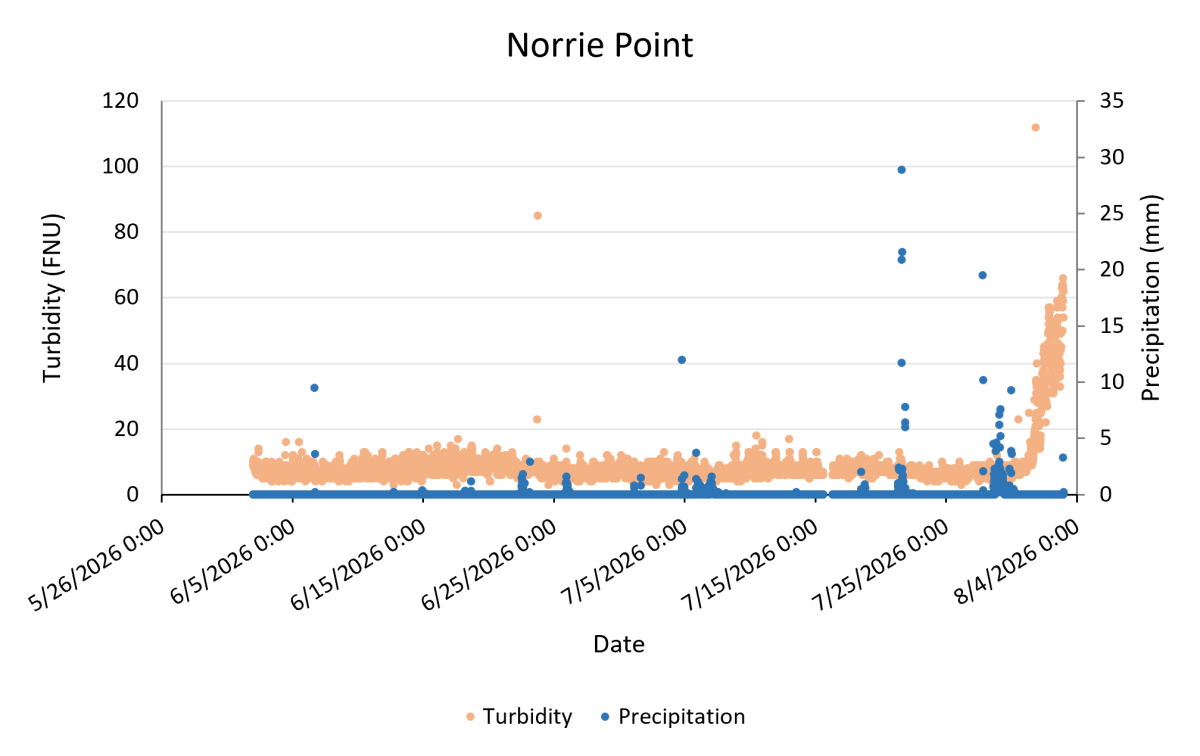
Figure 4 – A graph of rainfall (blue) and turbidity (orange) measured at Norrie Point Environmental Center in Staatsburg, NY from June through early-August 2026.